Planning - The User Interface - Planning- and project view - Color mapsStatus |


|
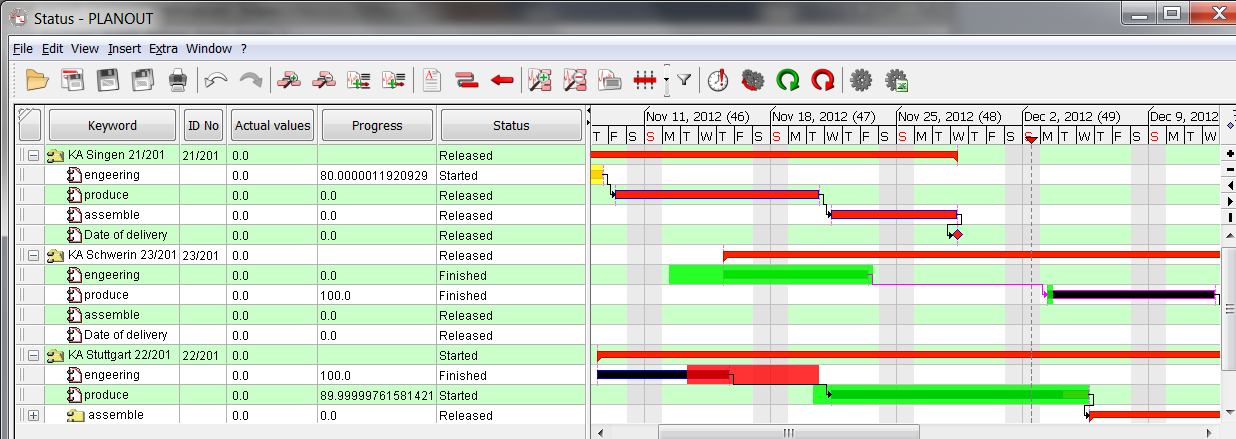
The status color-display shows you in color the time of your jobs.
Green indicates that the status of the process is exactly the plan: The actual start as well as the actual end date are located near the planned values (The tolerance range is set via a parameter).

Status green
Yellow means that the process has started later than planned: The actual start date is farl behind the scheduled start date. The end date however has not been entered or is within tolerance.

Status yellow
Red means a delay in the process: The actual end date is far behind the planned end date.

Status red
The tolerance range
The tolerance range specifies how many days of the actual start and actual finish dates may differ from the plan target start and target completion date.

Status with a tolerance of 1
The tolerance range for the actual data in the status view can be adjusted in the options of PLANOUT (Tools-> Options-> Advanced Settings-> View Settings-> tolerance for actual data in the status view)